Seismicity from the ISC Bulletin - Part I
This lesson shows a simple example on how to plot earthquake epicenters selected from the ISC Bulletin
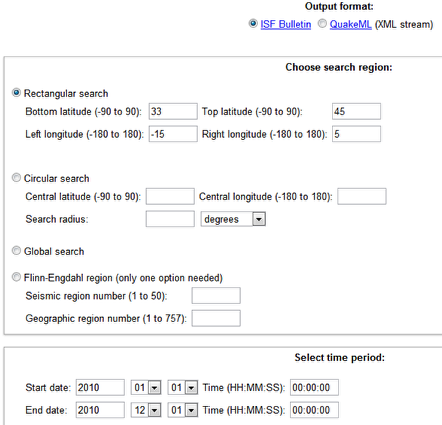
Open the ISC Bulletin page at http://www.isc.ac.uk/iscbulletin/search/bulletin/ This example uses data extracted with the following parameters. To make the query hit the "Search bulletin" button further down the page (not shown)
When the it finish save the displayed contents as an ascii file (in html is no other option is offered you by your browser), open it with an text editor and remove the first ~22 lines or so. Make sure the file is named with an .isf extension. In this example we named the file as "IBerian_seis_2010.isf". At the end the beginning of file should look like next figure.
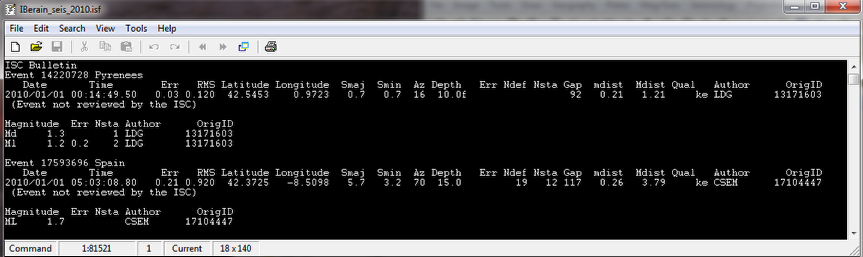
First lines of the IBerian_seis_2010.isf file with the contents of the query done if first step.
Create a base map where data will be plotted
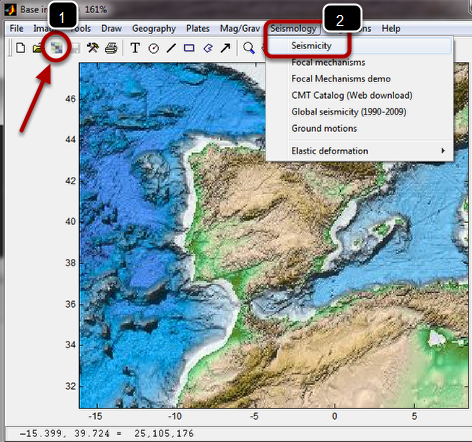
Image created with the default global image accessible via the Base map mosaic tool (1) (actually any other base map with geographical coordinates would equally well). Next select the "Seismicity" tool as shown on (2) above. This opens the tool displayed below.
Load the IBerian_seis_2010.isf file and select plotting parameters
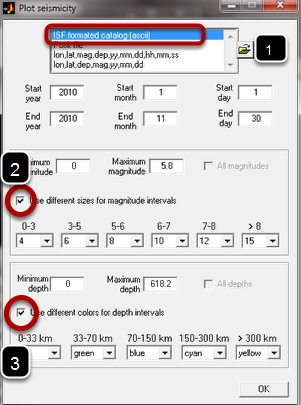
Select the first option in (1) browse for the IBerian_seis_2010.isf that we created above and check the boxes (2) and (3)
One year of seismicity

Red dots represent seismicity shallower than 33 km, green dots represent seismicity between 33-70 km depth range and the blue ones hypocenters between 70 and 150 km. Note that all dots look the same size because seismicity in this area is (fortunately) generally of low magnitude and larger events did not occur here during the year of 2010.