Make a GMT map with a couple of clicks
Show how to automatically generate a GMT batch (script) to create a map with GMT. WARNING: this lesson assumes that you have GMT and Ghostscript correctly installed on your system.
Load the grid. We will use the grid created in the "SRTM Mosaic directly from Web" lesson
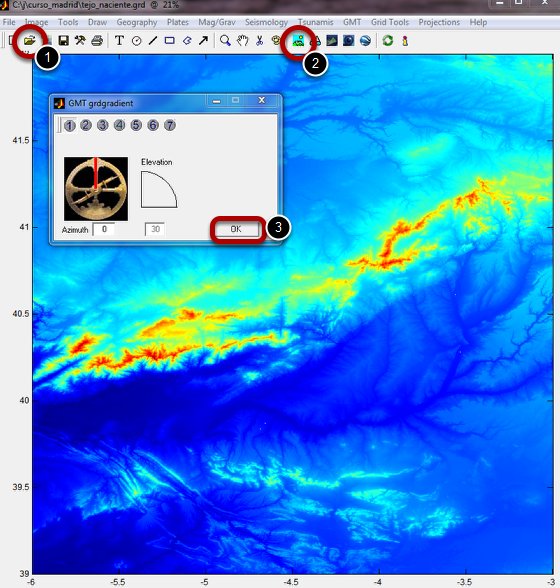
Load the "tejo_nasciente.grd" grid that we created previously on the "SRTM Mosaic directly from Web" (1). Call the illumination tool (2) and just use the defaults which are fine for this case (3)
Call the "Write batch tool"
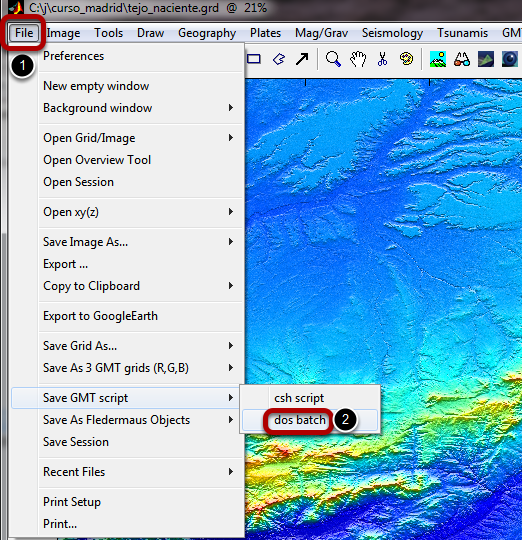
We are now going to generate a GMT script that will create a PS figure very similar to the one displayed by Mirone but using a map projection. The procedure is very simple and explained by the step (1) and (2) above, which call the "Write GMT batch" tool shown below.
The "Write batch tool"
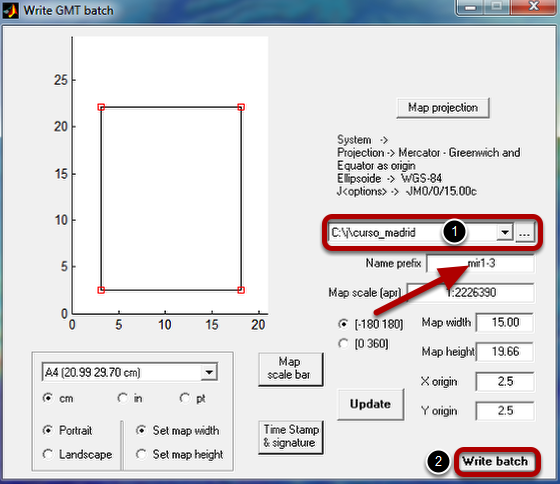
By default almost all parameters are set with appropriate values. The rectangle represents the image size can be dragged and/or resided. To do that double-click on it so that the red squares show up indicating that it can be reshaped. One important thing to decide is where the batch file will be saved. You do that on the pull down menu (1). The other thing to notice is the base name of the batch file (where the arrow points to), that is created taking into account the date that the program is run. In this case the name is "mir1-3". You can also select a map projection but here we will use the default "Mercator" projection.
To finish hit the "Write batch" (2) and a little window pops up informing that the batch file was created successfully.
Run the batch

Open one Windows file explorer, navigate to where the batch file was saved and just double-click on it. In this case it takes a little bit to run (some seconds) because the grid is not so small. When it finishes running, one postscript file with the same base name and extension '.ps' is created.
The GMT created figure
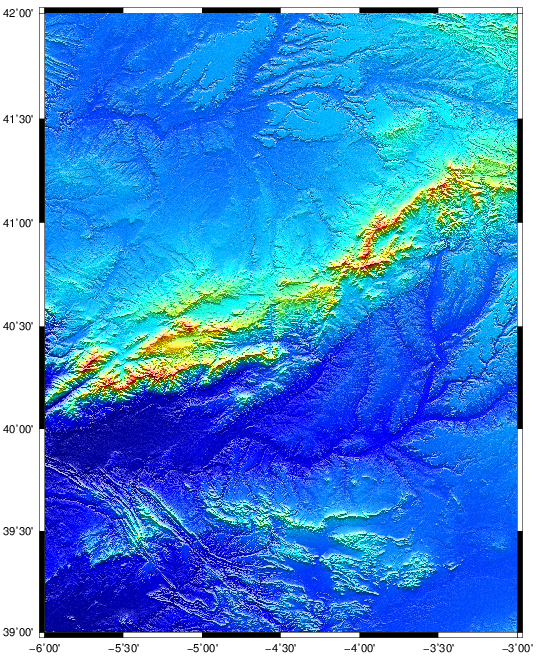
And here it is. You can now open the "mir1-3.bat" file with a text editor and change whatever you want, for example to add more layers to the plot but that obviously requires some knowledge of the GMT syntax.