Change color palette
Show how to change among the available ~100 different color palettes and manipulate (stretch/shrink) an individual one.
The default grid's view
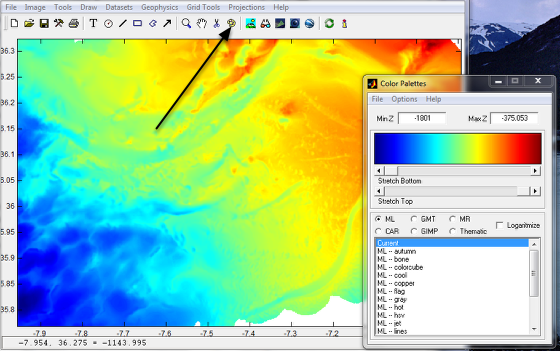
The default color scale is the one that Matlab call "Jet". Next click on the icon with painter's palette as pointed by the arrow. This brings up the Color Palettes control window. Clicking on any palette names of the list automatically change the color scale.
The Caris "Earth" color scale
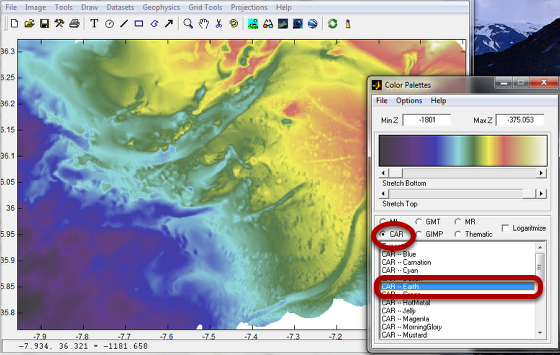
Here we selected the Caris color scale known as "Earth". We can also change any of the available colors. For that ... see next
Modify the color scale
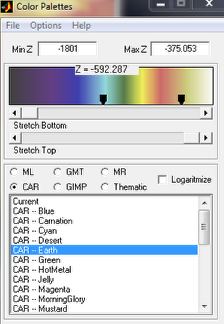
Insert markers on the color scale. You do that with a double click on the palette image. They show up as black markers that we can click-&-drag to modify the color schema. That's what we show on the next image.
Manually modified color palette
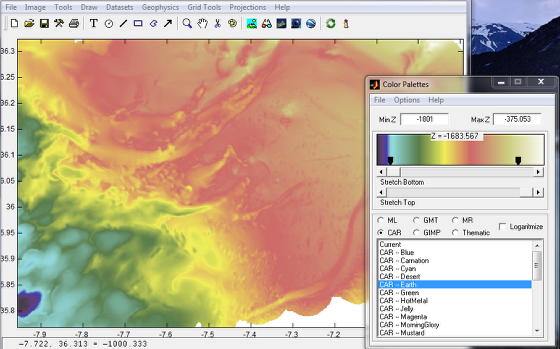
Modifying the color pallete instantaneously updates the image. The marks also display the grid's value to which that color is assigned.